
 The lecture encyclopedia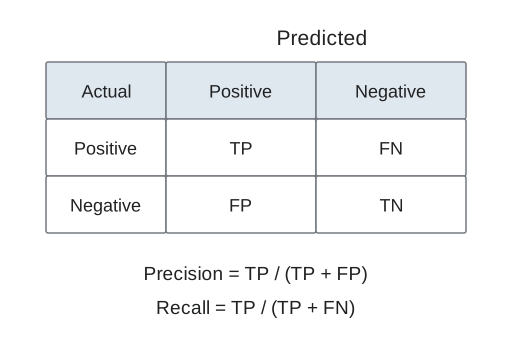
A model's usefulness depends on how its errors are measured. Regression predicts quantities and classification predicts categories, so their evaluation measures answer different questions. Choosing an appropriate metric requires understanding both the prediction task and the consequences of mistakes.
Regression error #
For ŷ = wx + b, the weight controls the line's slope and the bias controls its intercept. Changing either changes predictions across the dataset. Mean squared error averages (y - ŷ)², penalizing large deviations strongly. Its units are the square of the response's units, so the magnitude should be interpreted in the context of the target and compared with a sensible baseline.
A score computed on the training examples measures fit to those examples. Evaluation on separate data addresses generalization. Preprocessing choices must preserve that separation.
Confusion-matrix terms #
For a binary classification task, a true positive is a positive case predicted positive, a false positive is a negative case predicted positive, a false negative is a positive case predicted negative, and a true negative is a negative case predicted negative. Which category is called positive must be stated before using these terms.
Accuracy, precision, and recall #
Accuracy divides all correct predictions by all predictions. Precision divides true positives by predicted positives. Recall divides true positives by actual positives. A denominator of zero requires an explicit convention rather than an unexplained calculation.[1]
Suppose 20 examples are truly positive. A classifier finds 15 of them and incorrectly labels 5 negative examples as positive. Recall is 15/20 = 0.75; precision is also 15/(15+5) = 0.75. The equality is incidental: changing the false-positive count affects precision without changing recall.
Imbalanced data #
If only one percent of cases are positive, predicting negative for everyone achieves 99 percent accuracy while detecting none of the positives. Accuracy therefore hides an important failure. Class-specific metrics and the confusion matrix reveal which observations are missed.
A stricter decision threshold can reduce false positives while increasing false negatives, although the exact tradeoff depends on the model and data. The appropriate balance follows the task, not a universal preference for one number. Report enough context to explain what the metric counts and which kinds of error it leaves hidden.