
 The lecture encyclopedia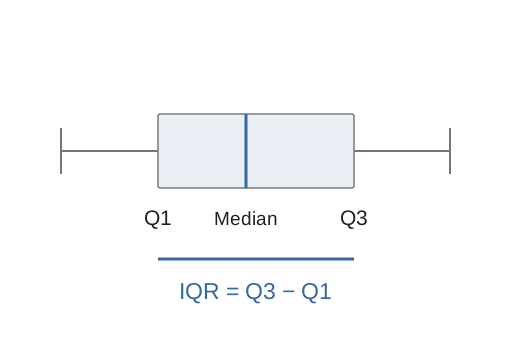
A reproducible cleaning workflow transforms a raw table into a documented modeling dataset. The central decisions concern which observations to retain, how to represent missingness, and which columns can validly predict the target.
Targeted cleanup #
Begin with column names, types, summary statistics, and missing-value counts. Drop a row when a missing required field makes that row unusable for the task, rather than automatically dropping every row with any missing field. Median imputation may be appropriate for some numeric columns; an explicit unknown category may be more interpretable for a categorical field.[1]
Filtering and duplicate removal change the dataset's composition. Record the criteria and compare row counts before and after each step so that an unexpected loss of data is visible.
Engineering a numeric duration #
A duration stored as text combines a value and a unit. Extracting digits alone can make unlike quantities appear comparable: minutes and seasons are not the same measurement. Restrict to a consistent unit or retain the unit as part of the representation before converting to a numeric type.
Interquartile range #
The interquartile range is Q3 - Q1, the distance between the upper and lower quartiles. A common screening rule flags observations below Q1 - 1.5 × IQR or above Q3 + 1.5 × IQR. These fences identify unusual values under that rule; they do not prove that a value is erroneous. A long-duration observation might be legitimate and important.
Features and labels #
Supervised classification uses input features, often written X, and known category labels, often written y. A binary classifier distinguishes two categories; multiclass classification distinguishes more. Training examples teach a rule, while separate evaluation examples test its performance on data not used to construct it.
A target or a direct consequence of the target must not accidentally appear among predictors when it would be unavailable at prediction time. Such leakage can produce impressive but unusable accuracy.
Visualization and interpretation #
Plots reveal distributions, category imbalance, and suspicious relationships before and after cleaning. A figure complements numeric summaries rather than replacing them. The final model's reliability depends on the whole preparation process, including decisions that occurred before the first model-fitting call.