
 The lecture encyclopedia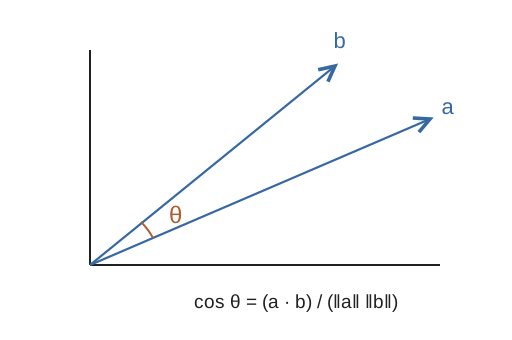
Similarity describes how observations resemble one another under a chosen definition. Shared presence, shared absence, vector direction, and linear co-variation measure different relationships. The correct measure depends on the information that matters to the question.
Binary observations #
For two binary vectors, count positions where both are zero, both are one, or only one is one. The simple matching coefficient includes both shared presences and shared absences. Jaccard similarity excludes shared absences and divides shared presences by positions where at least one is present.
For baskets {apple, bread, milk} and {bread, milk, tea}, the intersection has two items and the union has four, so Jaccard similarity is one half. Counting every product absent from both baskets would overwhelm the meaningful purchases with irrelevant agreement.
Cosine similarity #
Cosine similarity divides a dot product by the product of the vectors' lengths. It compares direction, allowing proportional vectors to have the same direction despite different magnitudes. This is useful for representations such as word-count vectors where overall document length may obscure a shared pattern. The expression is undefined for a zero vector unless an application supplies a special convention.[1]
Pearson correlation #
Pearson correlation measures standardized linear co-variation. Values near 1 or -1 indicate strong positive or negative linear association; a value near zero does not exclude nonlinear structure. A symmetric relationship such as y = x² can have low linear correlation while being completely determined by x.
Correlation also does not establish causation. A third factor can influence both variables, or selection and measurement choices can produce an apparent relationship. Scatterplots help reveal patterns that one coefficient hides.
Preparing a representation #
Preprocessing includes cleaning, encoding categories, scaling measurements, imputing missing values, and engineering features. Each transformation changes what subsequent comparisons mean. For example, replacing a missing measurement with a mean makes it appear typical in that feature, which can distort distances if missingness itself is meaningful.
Keep the original meaning of each feature visible throughout the workflow. A mathematically valid formula can still answer the wrong question when applied to an unsuitable representation.