
 The lecture encyclopedia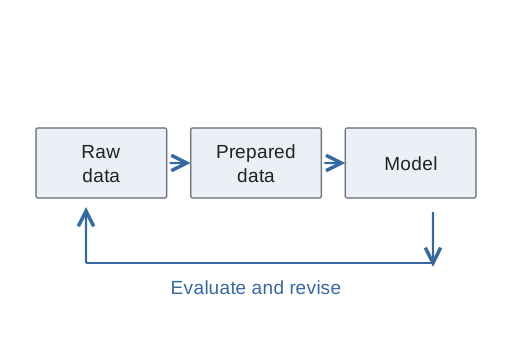
Data mining uses computational and statistical methods to discover useful structure in data. A useful result depends on how observations are collected, represented, cleaned, and evaluated, not just on choosing a model. The same table can support different questions depending on what its rows and columns mean.
Observations and features #
A row commonly represents an observation and a column represents a feature. In a flower dataset, an observation may contain several measurements and a species label. Measurements are inputs; the species is an output when the task is to predict it. Dimensionality is the number of features, rather than the number of rows.
Data may come from flat files, structured documents such as JSON, databases, or larger collections of mixed formats. Before analysis, establish units, types, missing-value conventions, and the population that the observations represent.
Major tasks #
Classification predicts a category, such as one of several species. Regression predicts a numeric quantity. Both are supervised when training examples include known target values. Clustering groups observations by similarity without requiring known category labels. Association analysis looks for co-occurring patterns, while anomaly detection seeks observations that differ from expected behavior.[1]
These tasks are related but not interchangeable. A cluster is not automatically a meaningful real-world class, and an association does not establish a causal relationship.
The analysis workflow #
Start with a question, acquire relevant data, inspect quality, prepare useful features, fit a suitable method, and evaluate its results. Missing values, incompatible units, duplicated observations, and poorly defined labels can all undermine the outcome. Feature scaling may matter when a method compares numeric distances.
A notebook combines executable cells with explanatory text and visual output. Cells can be executed out of order, so a successful isolated cell is not proof that the whole analysis can be reproduced from a clean state.
A simple classification example #
Suppose two flower measurements appear to separate labeled examples. A hand-written threshold rule can illustrate classification: one branch predicts one species and another branch makes a second comparison. Evaluating the rule on examples not used to construct it tests whether the relationship generalizes. A rule that only memorizes the observed rows has learned little about new data.